
Using sensors in the Arctic, a professor hoped to visually depict the ice melting for an audience a continent away—until climate change itself disrupted his plan.
by Sala Levin ’10 | Photo courtesy of Cy KeenerCy Keener stepped out onto the nearly monochromatic, frozen landscape surrounding the northernmost city in the U.S. The scene outside at Utqiagvik, Alaska (formerly known as Barrow) was breathtaking this April morning: Giant, fractured blocks of sea ice loomed over the assistant professor of art, and the stillness was at odds with the ocean that churned silently and invisibly beneath the surface.
Keener was at once awed and melancholic. He knew that this vast expanse of ice at the top of the world—the oldest sections of which have shrunk by 95% since 1980—could vanish within a few decades.
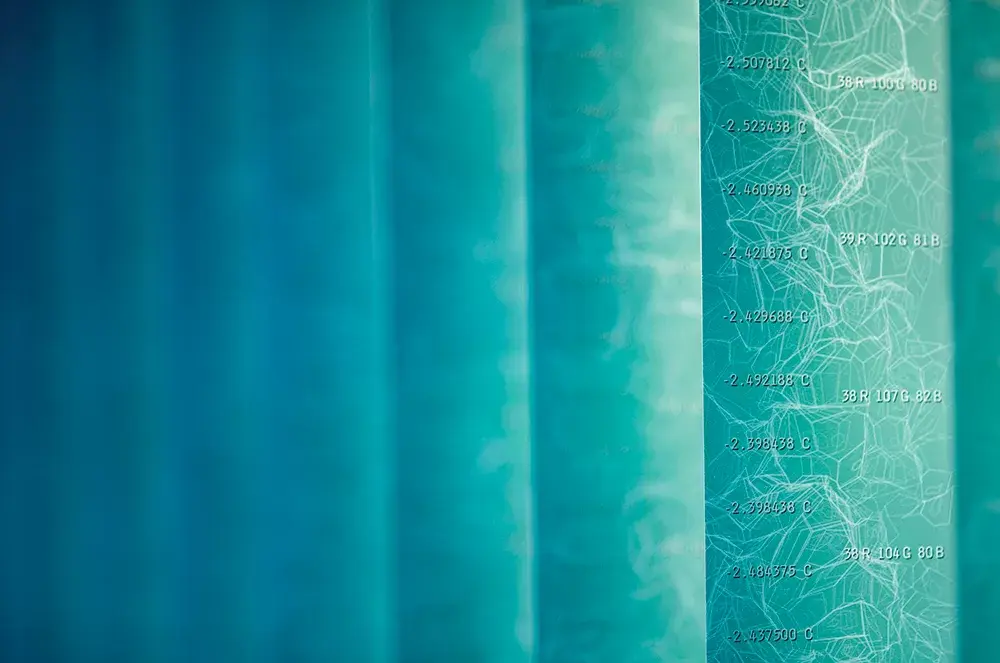
Some 3,400 miles away, in a street-facing window of the Rockville, Md., VisArtscenter, Keener planned to visually document this ice from May to September as it slowly thinned. Using sensors buried two meters into the ice, Keener and his collaborator, Justine Holzman of the University of Toronto, intended to track its thickness daily, transforming that information into “Sea Ice 71.348778º N, 156.690918º W,” an art installation in which hanging strips of 6-foot-long, blue-green polyester film would reflect the depth of the ice. Over the warm months, the lengths of the ever-growing number of strips—Keener added new ones every four days—would dramatically shorten.
But then, two snags: First, a polar bear destroyed one of the two sensors. (Standard job hazard.) Then, the piece of ice containing the second sensor detached from land and floated out to sea in mid-June. The ice further broke up, and the buoy traveled into open water. Keener could no longer receive data about ice thickness—unprecedented warming had already melted the ice he was depending on.
“Of course, I was disappointed, but I also think it’s indicative of what’s going on in the sense that in past years that ice might not have broken off” until much later, says Keener.
Instead of hanging strips, Keener made a series of six 30-by-70-inch maps of Arctic sea ice extent for 2019 to compare with sea ice extent in 2007.
Trained as both an artist and architect, Keener has long been interested in how technology, art and the environment intersect. He’s used sensors to track the movement of stones along a riverbed during flooding and buoys to monitor ocean currents. While working on a glacier project, Keener met a researcher from the National Ice Center, who linked Keener with a National Science Foundation-funded Arctic expedition.
“One of the struggles of art that tries to engage in issues like climate is that it gets cloistered away in a gallery setting … where not that many people go,” says Keener. “I liked the idea of the street being the audience, as opposed to whoever wandered into [a] gallery. It’s a 3-D billboard for melting Arctic ice.” TERP
Digital Ice Core from Cy Keener on Vimeo.
Issue
Fall 2019